Field Service Analytics

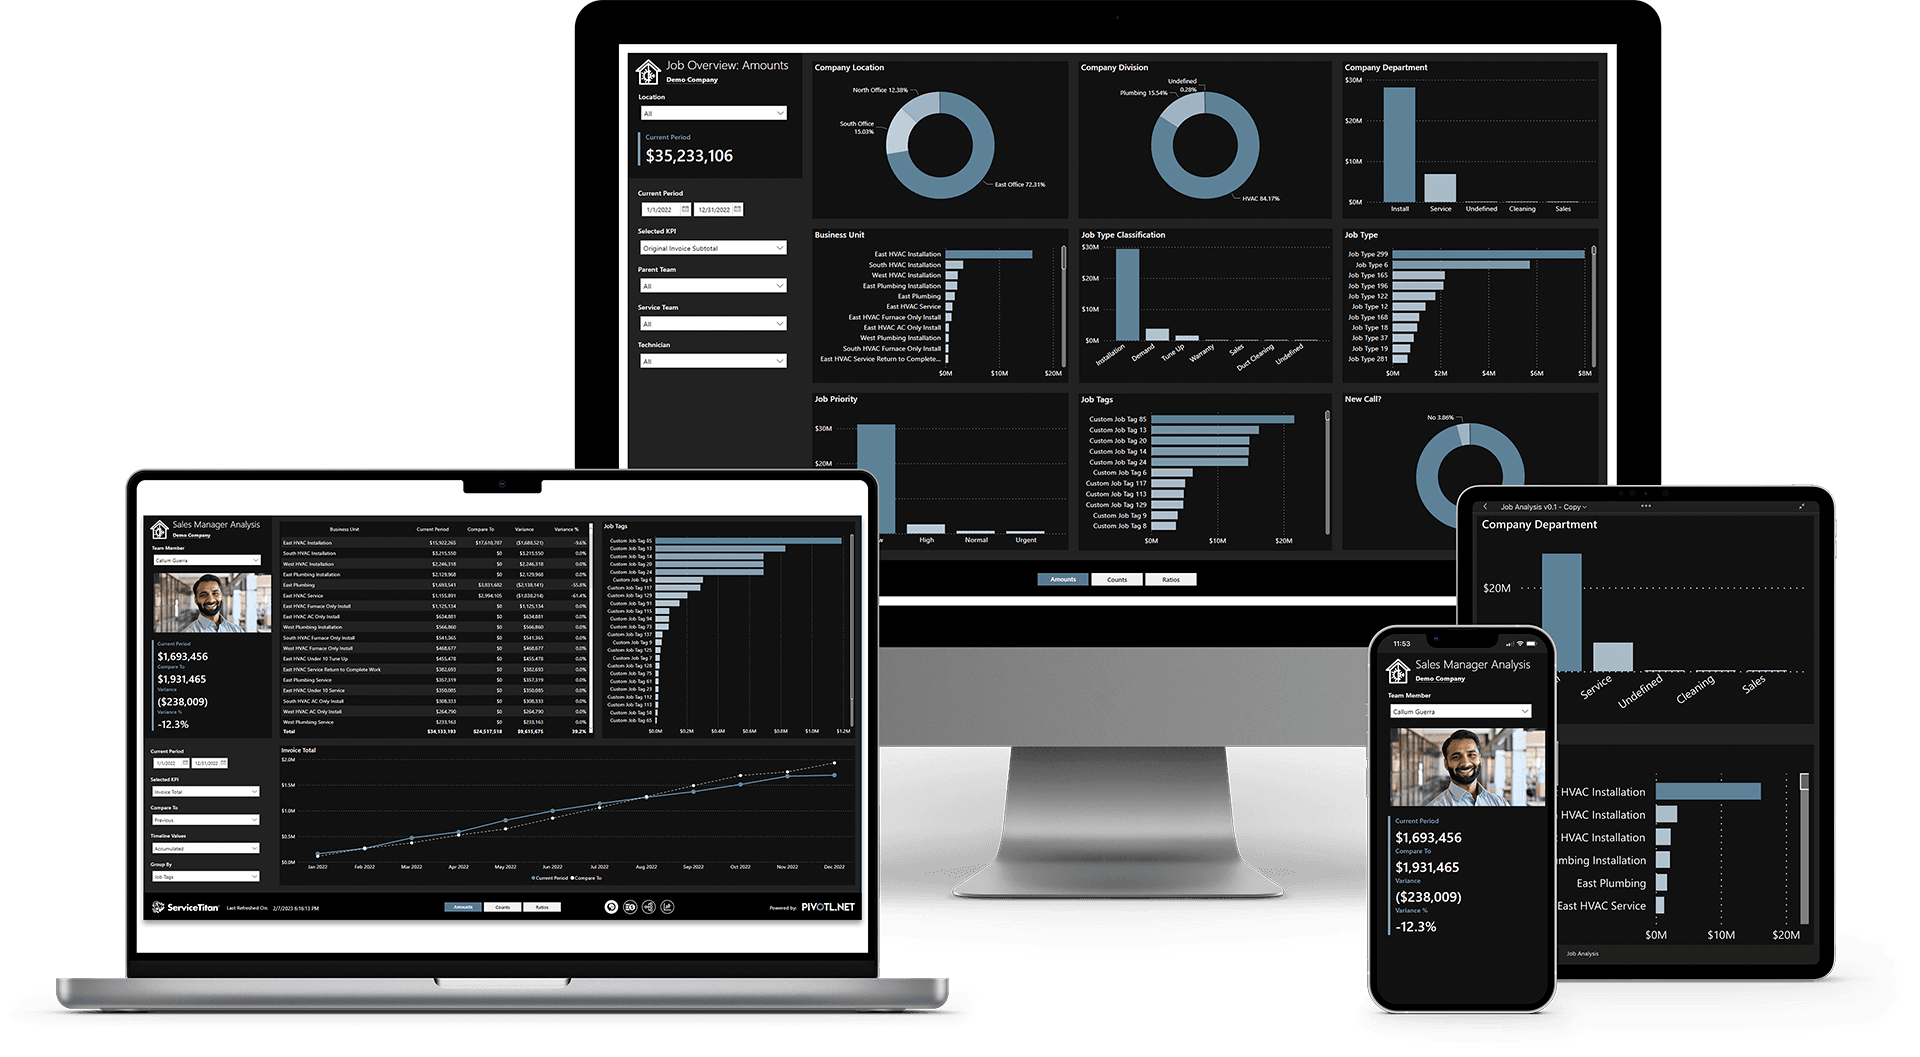
The PIVOTL team is excited to announce the launch of our newest product:Field Service Analytics! Users can now replace their static reports with interactive, purpose-built dashboards that give them the insight they need to make smart, proactive decisions that drive profitability.
Our goal in developing the Field Service Analytics solution was to create a cohesive analytics experience for the field service industry, and give owners, managers, field service techs and other members of your company the insight they need to take action on behalf of the business. They get these insights through four unique modules: Demand Forecasting, Pace Analysis, Sales Analysis and Job Analysis.
DEMAND FORECASTING
The Demand Forecasting module allows managers to determine if their department is under, over or at capacity, and meet targets based on that data.
PIVOTL Demand Forecasting users have the unique ability to see:
- Technician availability based on the technician shift schedule.
- Clearly see the number of technicians scheduled by office location, division, department or business unit.
- See how shifts break down by service team so that adjustments can be made to meet service goals.
- Job Assignments for yesterday, today and projections for the coming week.
- Get an accurate assessment of yesterday’s performance, how today is looking, and how the rest of the week is shaping up.
- Enable managers to proactively take action through a better partnership between service teams and the call center.
- Make decisions to increase or reduce the size of your staff and anticipate customer service needs.
- Call Volume Goals.
- Know immediately if the business is tracking toward meeting call volume goals.
- See Capacity variance by department and business unit or for entire divisions or office locations.
Through the Demand Forecasting module, managers can quickly analyze their call volume by business unit and job type to easily understand the composition of upcoming activity and anticipate the skills required for scheduled work.
PACE ANALYSIS
Managers and team leads can make real-time adjustments based on their team’s pace to meet sales and productivity goals with the Pace Analysis.
The Pace Dashboard is updated daily throughout the month to give users immediate visibility to know:
- If they’re on track based on the pace of their sales goals.
- Daily revenue totals are used to compute if monthly sales goals are on track to be achieved.
- Automatically harvest call activity to eliminate costly and error-prone manual reporting.
- Team leads and technicians spend more time leading their team and supporting staff.
- If they’re on track with the pace of their call volume goals.
- Instantly see call volume totals against targets for the day and month.
- Estimate the number of calls that teams, departments, divisions and locations will complete in the current month.
- If they’re on track to meet their productivity goals.
- Evaluate the revenue per call and calls per day per technician to reward exceptional performance or to determine where additional education or support is needed.
- How to adjust daily goals to meet monthly, and longer-term targets.
- Managers can quickly adjust their tech schedules based on priorities to meet sales goals.
Quickly toggle between different tech teams to give at-a-glance insight into the team’s or department’s productivity during daily huddles.
SALES ANALYSIS
The Sales Analysis module enables business owners and managers to determine the sources that originate new sales opportunities, and identify which are most effective. Rate the quality of generated leads, assign sales revenue amounts, determine sales rep performance and much more to craft a more profitable sales program for your business.
Use the Sales Analysis Dashboards to analyze the company’s lead generation and sales activity in key areas, such as:
- Channel Performance: Understand the lead sources that originate new opportunities, and which are most effective.
- Measure activity in traditional marketing campaigns.
- Break out technician-generated leads for detailed analysis and rank team member success.
- Sales Manager Performance: Evaluate your sales team’s timeliness and effectiveness in executing on new leads.
Users can view lead generation and sales revenue compared against previous performance, or in relation to their sales targets.
JOB ANALYSIS
Analyze completed jobs to measure revenue in any location, division, department or business unit and evaluate which are the most impactful to your business.
- See monthly or accumulated revenue for any time period.
- Compare revenue to performance in a similar prior period.
- Examine the anatomy of your jobs.
- Understand how job types, and the factors that accompany them, correlate with revenue.
- Design calls with revenue at the forefront – emphasize your highest revenue jobs, and rank by priority.
- Break down how each job, from every angle and attribute, impacts your revenue.
- Accurately understand job volume.
- Understand implications at different levels.
- Drill down to the business unit level, and see how different job types affect revenue for each.
- Uncover potential issues in business departments – address performance drop-offs or capitalize on. opportunities by identifying them quickly and in relation to expected or previous performance.
- Understand which team members and teams bring you the best profits.
- Reflect on past goals and develop future targets.
- See historical revenue vs. goals/targets for all your business categories, as well as in the aggregate.
- Quickly see manager and company goals, and budget these accordingly.
- Focus on business department actuals to help set realistic goals.
- Identify and under and over-performing business units.
Through these four modules, users can unleash the wealth of rich development data locked inside their field service management software. In addition to enterprise-level business analytics, PIVOTL also offers solutions to integrate other data sources from your company, including CRMs, accounting software, spreadsheets, marketing software and more.
Ready to learn how PIVOTL’s Field Service Analytics solution can help your company? Visit pivotl.net/